This activity was created by
Any questions, comments, or corrections can be directed to us at
If you are using our resources, we would love to hear from you!
Use of our material:
This activity was created by
Any questions, comments, or corrections can be directed to us at ![]()
If you are using our resources, we would love to hear from you!
| NATURAL
SELECTION Students use beads to mimic natural selection in a population
|
LIZARD
ACTIVITY Students use actual data to try and determine ancestral connections between lizard populations 
|
THINGS YOU WILL NEED:
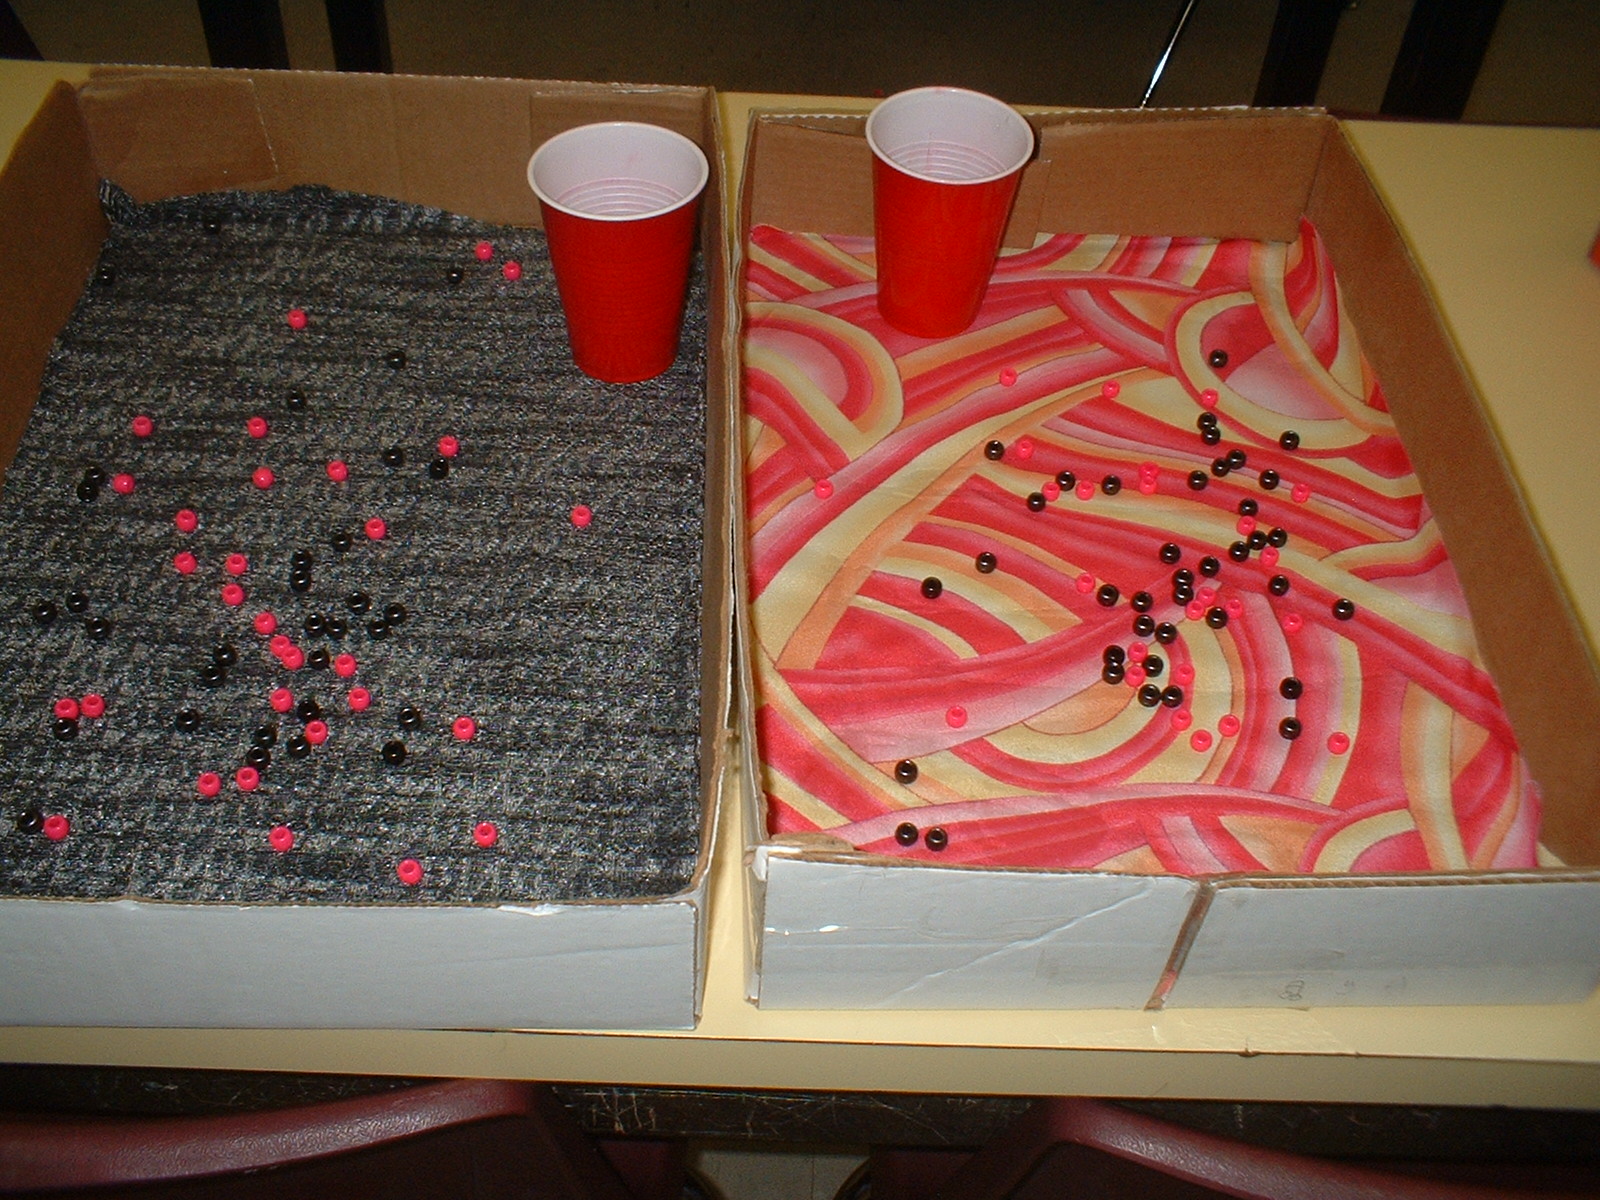
Copy paper box lids- 2 per group of 3-4 students
2 COLORS of pony beads (enough for each group to have 75 of each color)
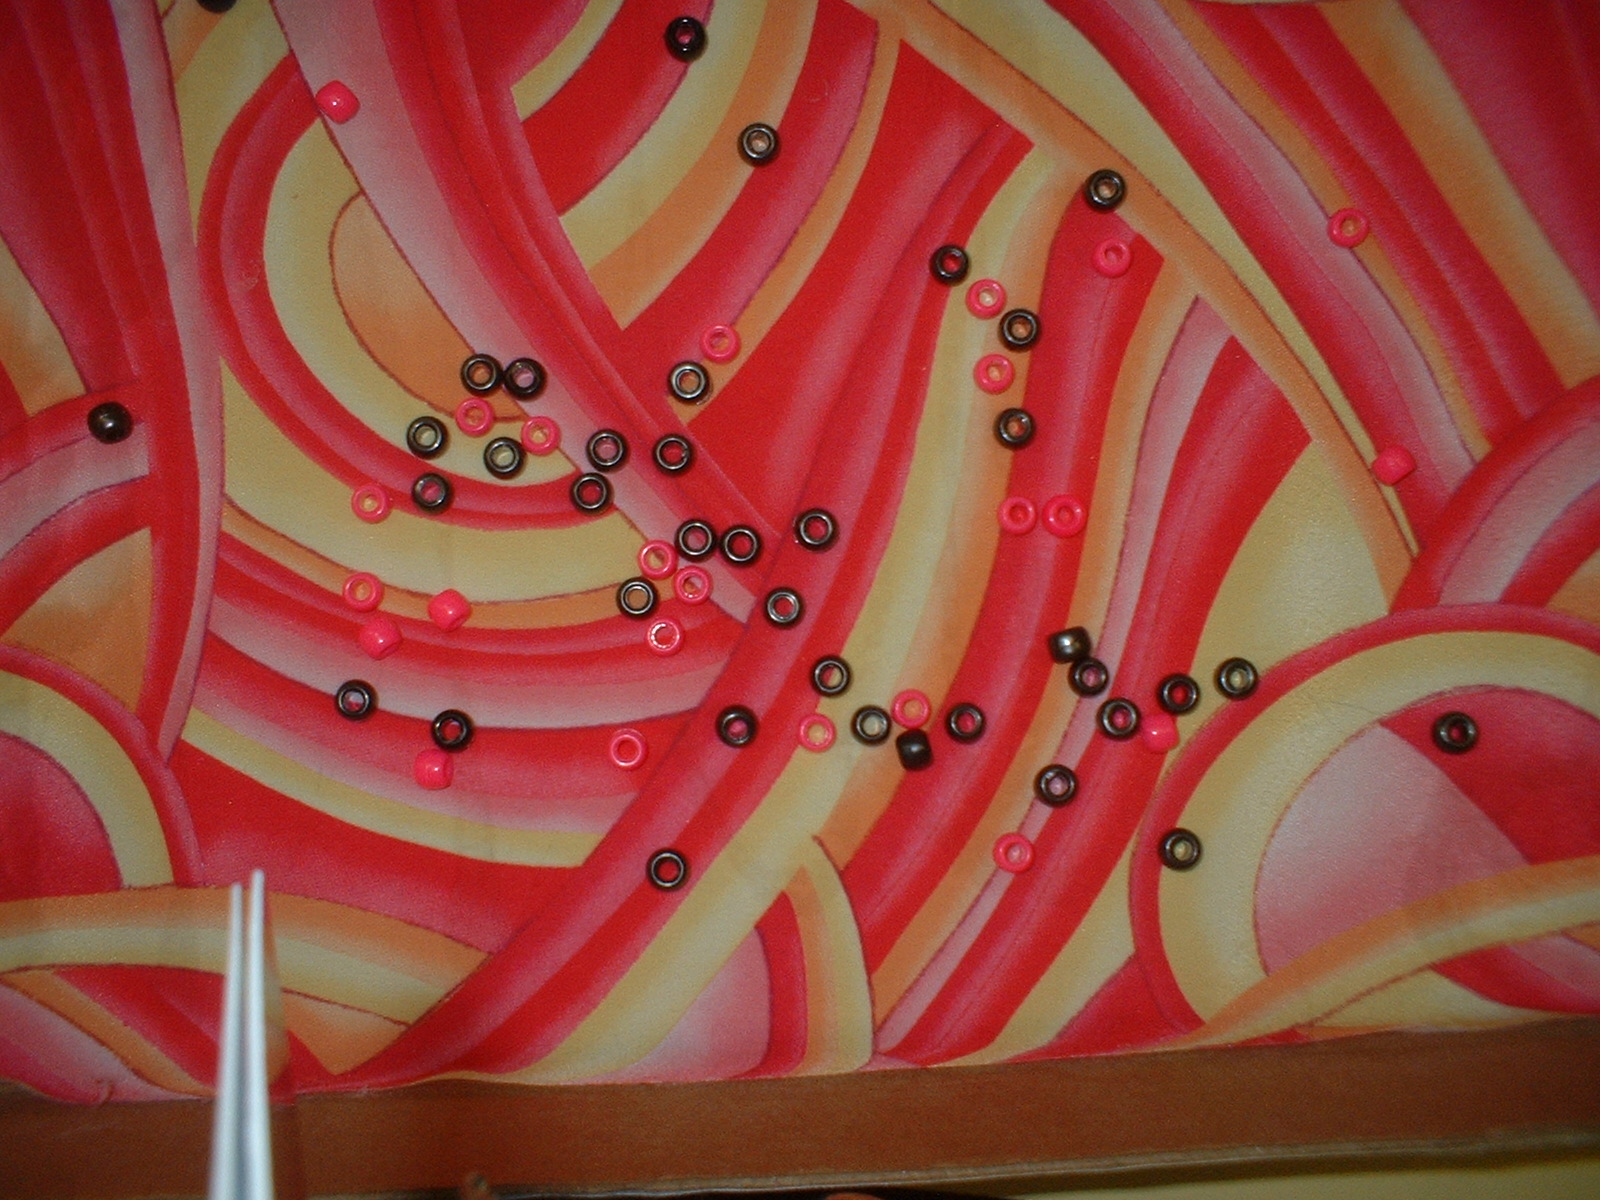
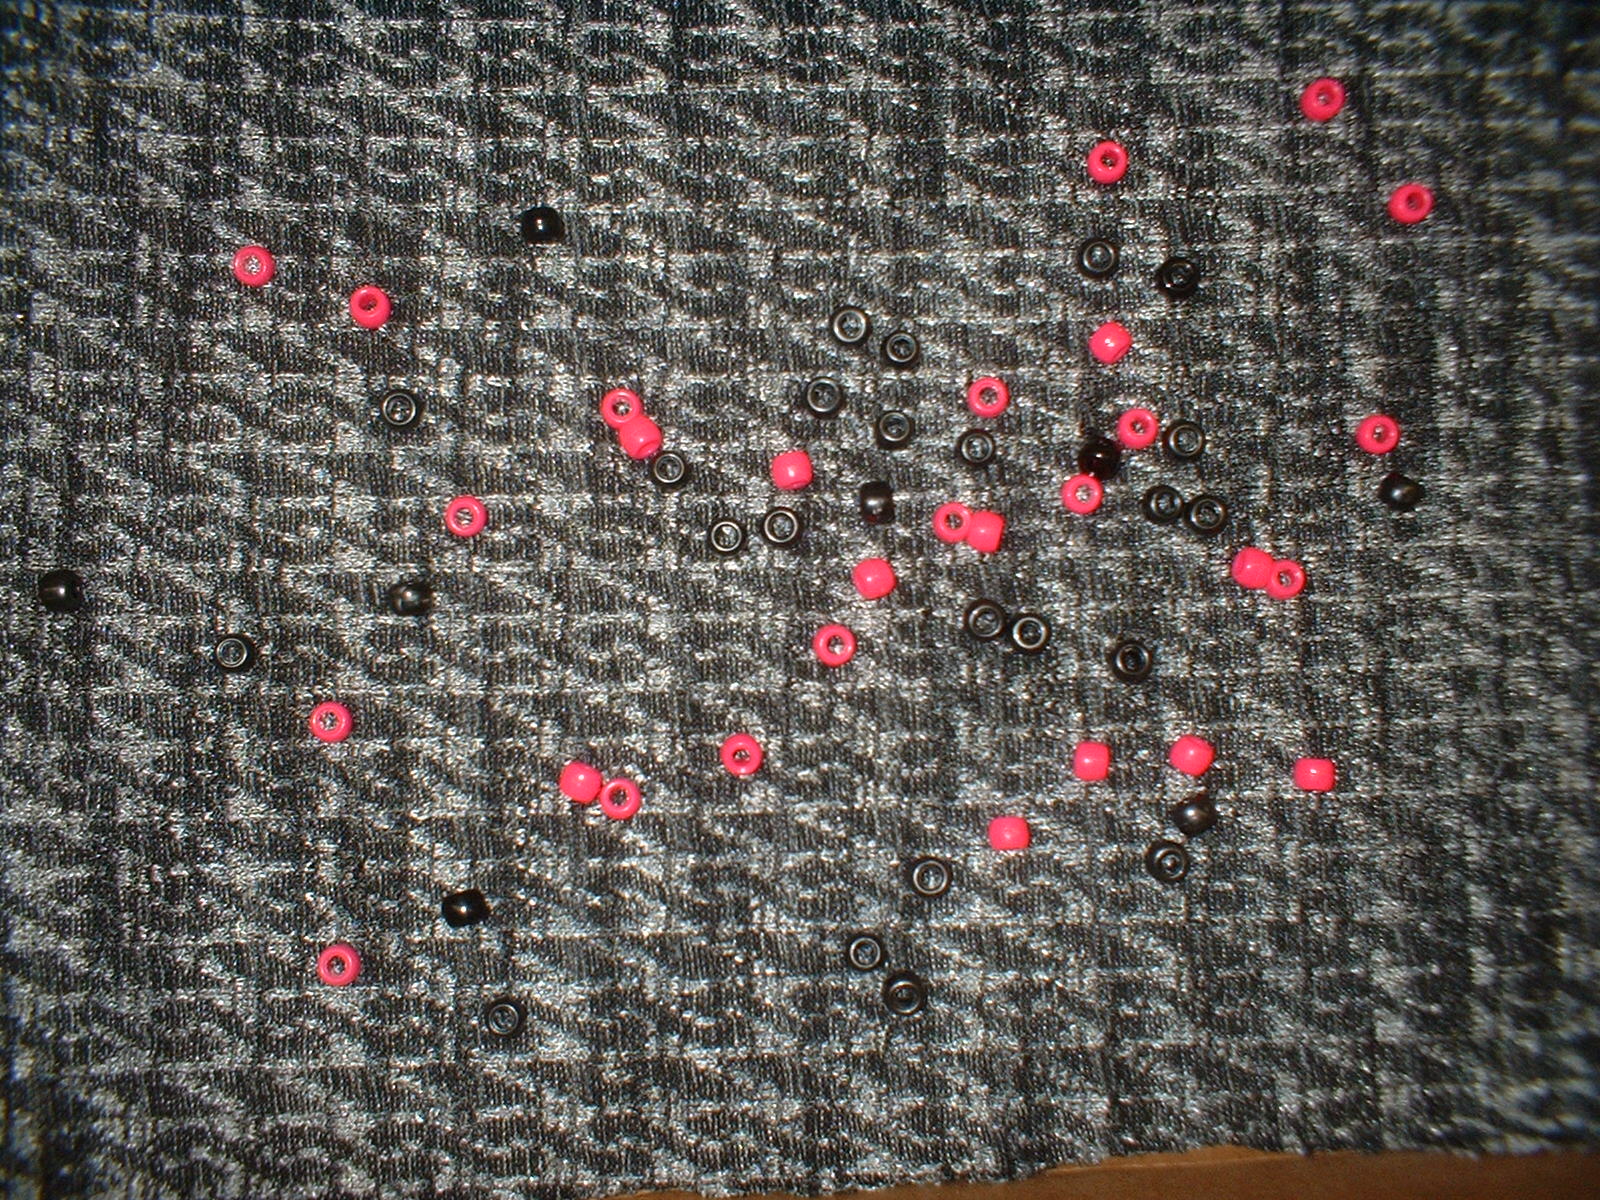
Colored fabric that each of the two bead colors will blend in with
(You will need enough
to cover a box lid X number of groups)
Plastic cups (1 per group)
Spray adhesive
AHEAD OF TIME:
Cut fabric to fit box
lids.
Use spray adhesive to attach fabric to inside of box lids.
Images by Riedell
Count out 75 beads of each color and place in cup
Copy off Natural
selection data sheet
(1 for
each student)
Copy off Natural
selection lab ?'s
ACTIVITY:
Students count out beads and put 50 of each color on the fabric
in the box lid and fill in “At start” column on tally sheet. One student
acts as the box shaker and “swirls” the box being
careful to keep beads in box! Others
in group are “predators looking for food”. When the box stops, predators
quickly look in box and grab first bead they see.
RULES:
You must take first
bead you see.
No picking your favorite colors.
Don’t look around in box for “a good one”
Box
shaker mixes beads again and predators quickly pick one bead each again.
Continue swirling and feeding until predators have picked 20 beads from box.
Count up beads and enter numbers in “After first feeding” column on tally
sheet.
REPRODUCTION:
For every two beads in box add another of that color.
Ex: if there are 42 black beads and 38 pink beads in the box after feeding, you
will add 21 more black beads and 19 pink beads to the box.
FEED
& REPRODUCE AGAIN:
Repeat feeding and reproduction procedures described above and remove 20 more
beads and add offspring beads, filling in the appropriate columns on their tally
sheet.
Have
groups put their data on board or projector and fill in class data sheet with
data from other groups and answer questions.
 |
LIZARD
EVOLUTION ACTIVITY
This activity was modified from http://www.ucmp.berkeley.edu/fosrec/Filson.html |
LIZARD LAB
Use the Lizards
Activity slideshow as you walk through the
activity.
Read/discuss general info in Lizard
lab about how islands are colonized.
Have students measure distances from each
island to African mainland. Fill in the map in the Lizard
lab showing the path you think the lizards moved as they
colonized the islands.
Give students a copy of the cladogram
handout and have students fill in the first cladogram showing their
idea about how the islands were colonized and how the lizards are related.
EX: If you think the lizards on Gran Canaria migrated from Lanzarote then
Atlantica lizards are the ancestors of the Stehlini lizards and Stehlini should
appear as a branch off the Atlantic line on your cladogram.
PART II: Follow sequence in
Lizard
lab packet. Look at geologic data.
"Does your story and cladogram relationships fit with the geologic date
about when the islands appeared. If not, you must change your cladogram.
EX: If you said the lizards on Palma migrated from Hierro, that probably didn't
happen since Palma is older than Hierro. If you need to, make a new
cladogram that is supported by the evidence.
PART III.
Look at the morphology of the lizards. Does this
evidence support your relationship story and your cladogram. EX: As lizards
evolved, you would probably see a gradual progression; not, increasing then
decreasing then increasing again in size.
Do you want to change your relationship story/cladogram?
PART IV.
Compare DNA
sequences.
HINT: It is easier to count differences if you cut apart the sequences,
attach them in order, and laminate the strips so students don't have to jump
from page to page.
Divide up the comparisons so each student only has to compare DNA between
several lizards. Post answers for students to write down all the data
Hand out Lizard
map and have students draw lines between islands to show
differences between lizard DNA (See Lizard
map with DNA data)
Is your story/cladogram
supported by the DNA evidence?
Most students will probably have said Stehlini lizards on Grand Cananary island
descended from Atlantica lizards that migrated from Lanzarote. DNA evidence does
NOT support this theory. Stehlini DNA is DIFFERENT from all the other lizards.
If students said they thought lizards split and moved from to Palma and Hierro
from Gomera, this is NOT supported by DNA evidence either. Palma lizard DNA is
most like Tennerife lizards.
The split probably happened at Tennerife. See possible Phylogeny
solutions
Scientists think the Stehlini lizards came from another migration possibly carried down on a current from the north
Bioteacher help Biology other units APBIOteacher help Riedell Science Home APBIO other units Zoology other units
sphynx moth: http://www.exploringnature.org/wordpress/?p=21
Lizards: http://www.ucmp.berkeley.edu/fosrec/Filson.html
Cartoon from: http://www.cartoonstock.com/newscartoons/cartoonists/rbr/lowres/rbrn15l.jpg
Finch image: http://focus.hms.harvard.edu/2006/090106/images/Nature_finches.jpg