 |
 |
 |
 |
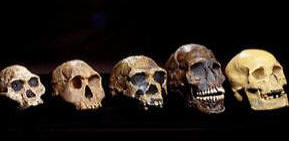
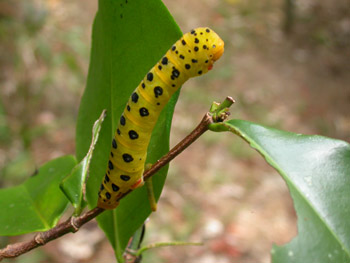
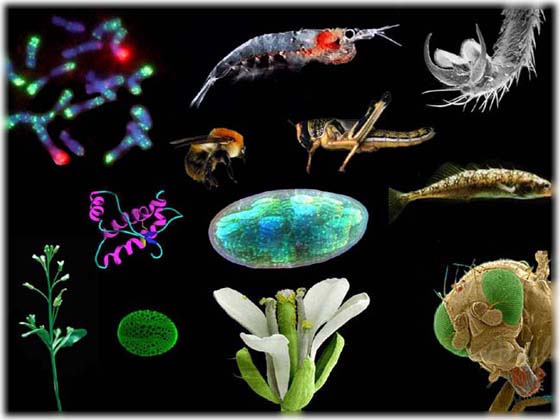
| EVOLUTION |
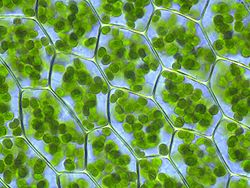
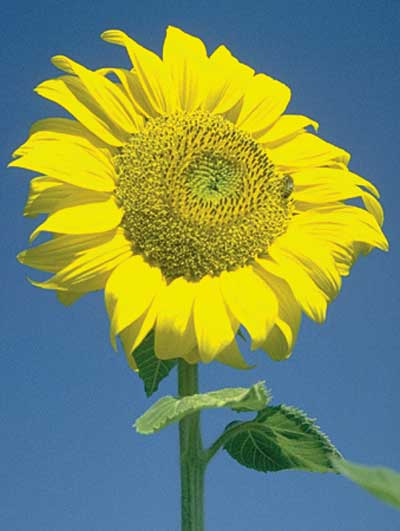
MATTER & ENERGY |
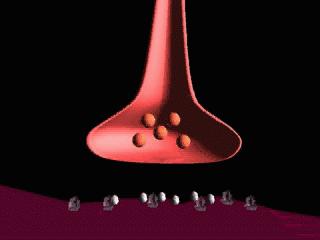
INFORMATION |
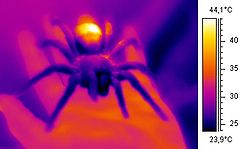
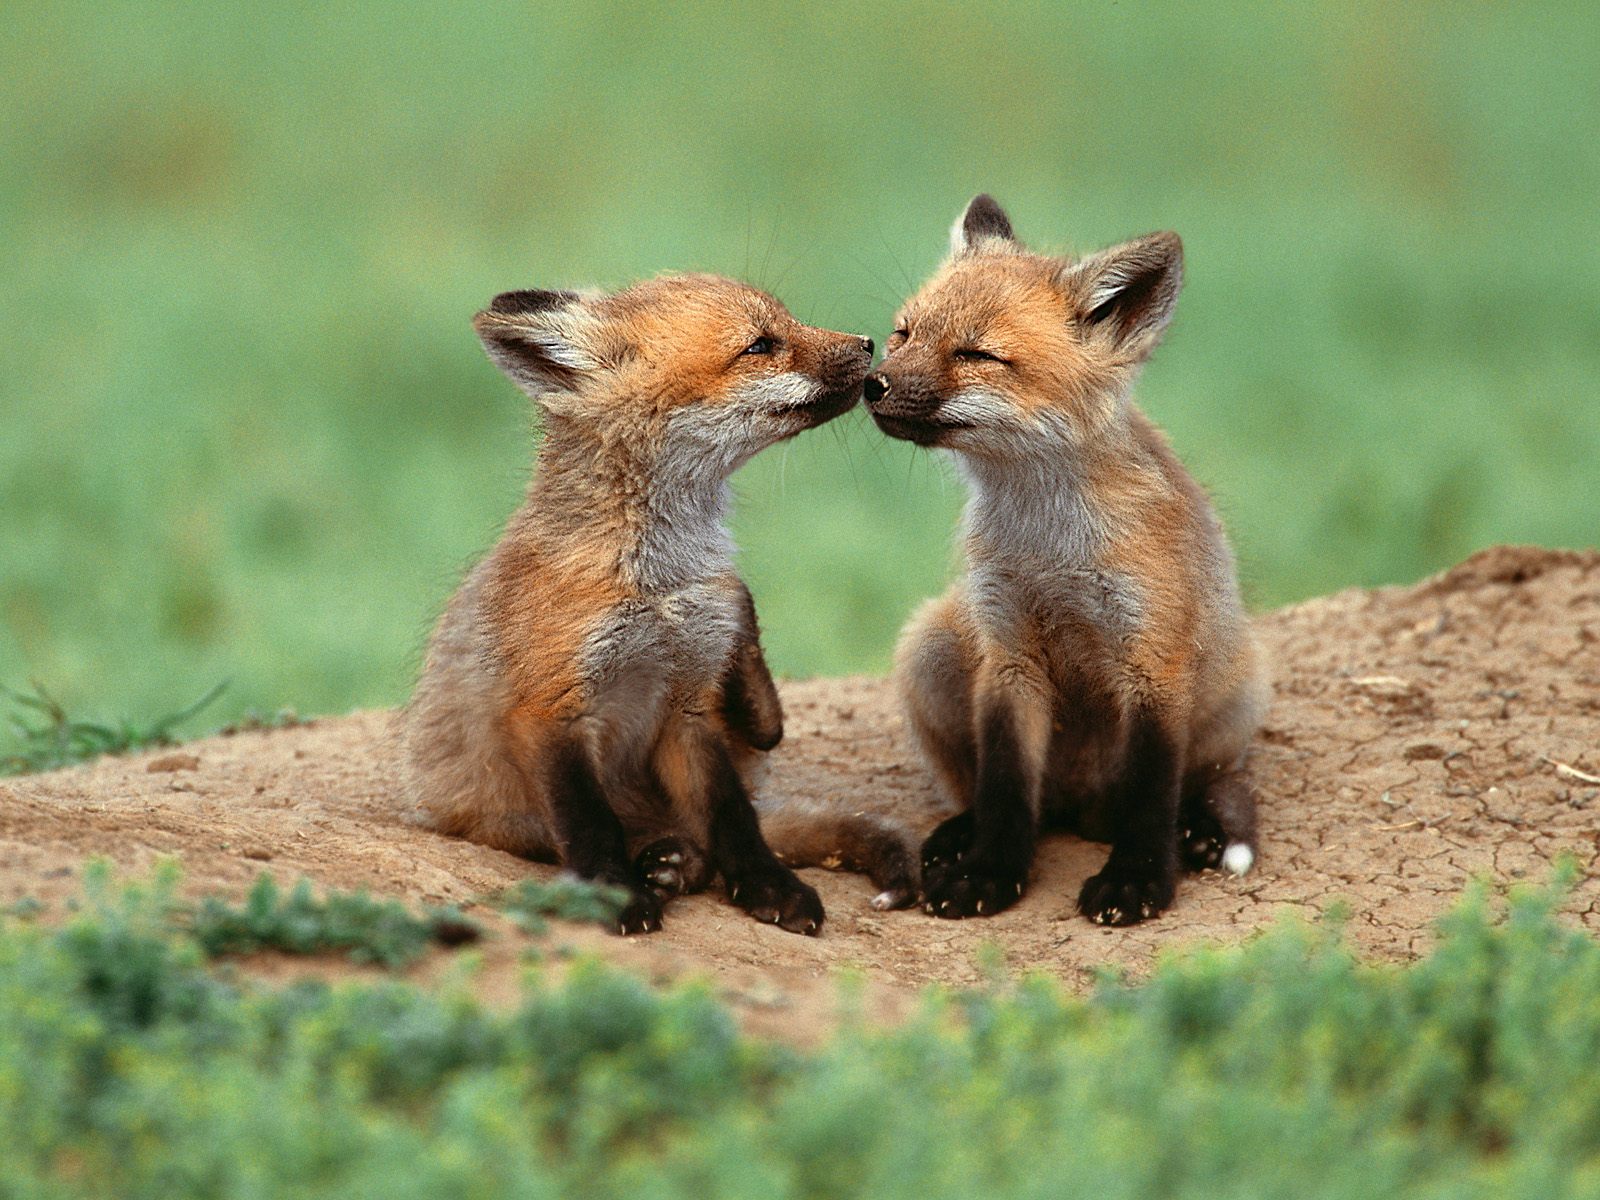
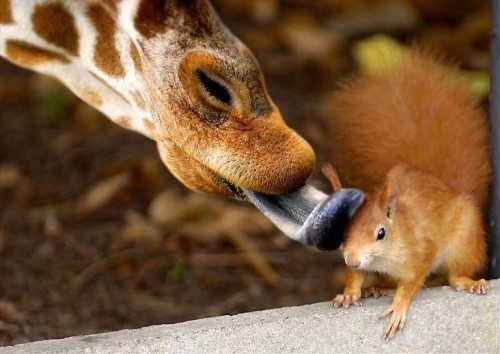
INTERACTIONS |
|
|
Use of our material:
All original materials
links are created by Kelly
Riedell for students in AP BIOLOGY classes at Brookings High
School and are licensed under a Creative
Commons Atribution-NonCommercial-ShareAlike 4.0 International
License.
We have worked very hard on activities,
Powerpoints/games/worksheets, etc to make this a resource for
our students. If you are using our materials, please give us
credit for our efforts by listing us as a source with links to
our site. DO NOT USE these materials for commercial
purposes. PLEASE DO NOT POST ANSWER KEYS FOR OUR MATERIALS TO
OTHER WEBSITES!
Any questions, comments, or
corrections can be directed to Kelly Riedell at 
|
To see your scores make
sure you
register for a login from AP Central .
Check out the
AP Central Student Site
I will post Twitter updates from
Trevor Packer as
tests are completed, graded, and posted.
AP BIO SCORES WILL BE
AVAILABLE FOR SOUTH DAKOTA
...WEDNESDAY JULY 15 at 7:00 am Central
AND
NOW WE WAIT . . .
2021 AP SCORES
More info about AP BIO scores
| Scores |
AP
BIO
|
AP
Environ
Sci |
AP
CHEM |
AP
Stats |
AP
US
Hist |
AP
World
History |
AP
US
Gov't |
AP
Eng
Lit &
Comp |
AP
Eng Lang
&
Comp |
AP
Human
Geog |
AP
Physics
1 |
AP
Physics
2 |
AP
Physics C
Mechanics |
AP
Physics
C
Electricity
Magnetism |
AP
Macro
Econ |
AP
Micro
Econ |
AP
Calc
AB |
AP
Calc
BC |
| 5 |
7% |
6% |
11% |
|
11% |
10% |
11% |
5% |
8% |
15% |
7% |
15% |
|
|
18% |
20% |
18% |
38% |
| 4 |
20% |
24% |
16% |
|
16% |
18% |
11% |
12% |
23% |
20% |
16% |
18% |
|
|
20% |
24% |
14% |
17% |
| 3 |
34% |
18% |
24% |
|
21% |
24% |
27% |
27% |
26% |
19% |
19% |
32% |
|
|
14% |
16% |
19% |
20% |
| 2 |
30% |
28% |
25% |
|
22% |
30% |
27% |
39% |
31% |
16% |
27% |
27% |
|
|
16% |
17% |
25% |
18% |
| 1 |
10% |
23% |
24% |
|
30% |
18% |
23% |
17% |
12% |
31% |
31% |
8% |
|
|
32% |
23% |
24% |
7% |
3 or
higher |
61% |
48% |
51% |
|
48% |
52% |
49% |
44% |
57% |
54% |
42% |
65% |
|
|
52% |
60% |
51% |
75% |
2020 AP SCORES
| Scores |
AP
BIO
|
AP
Environ
Sci |
AP
CHEM |
AP
Stats |
AP
US
Hist |
AP
World
History |
AP
US
Gov't |
AP
Eng
Lit &
Comp |
AP
Eng Lang
&
Comp |
AP
Human
Geog |
AP
Physics
1 |
AP
Physics
2 |
AP
Physics C
Mechanics |
AP
Physics
C
Electricity
Magnetism |
AP
Macro
Econ |
AP
Micro
Econ |
AP
Calc
AB |
AP
Calc
BC |
AP Computer Sci |
| 5 |
9.4% |
11.8% |
10.4% |
16% |
13% |
9.2% |
15.3% |
9.3% |
12.5% |
11.6% |
8.7% |
13.9% |
40.9% |
40% |
19.5% |
23.1% |
19% |
44.2% |
10.8% |
| 4 |
22.5% |
28.3% |
18.2% |
20.6% |
19.2% |
22.8% |
16.2% |
17.3% |
20.4% |
22.1% |
17.7% |
24% |
26% |
22.1% |
24.8% |
28.7% |
20.4% |
17.4% |
23.3% |
| 3 |
36.6% |
13% |
26.4% |
22.9% |
26.6% |
28.2% |
25.1% |
33.5% |
29.1% |
24.5% |
24.5% |
34.6% |
16% |
11.5% |
18.3% |
16.5% |
20.5% |
19.2% |
36.6% |
| 2 |
24.2% |
25.4% |
23.8% |
21.6% |
20.4% |
26.1% |
21.8% |
27.7% |
26.2% |
10.9% |
26.3% |
21.5% |
9.5% |
16.3% |
16.2% |
14.2% |
24.1% |
14.4% |
17.5% |
| 1 |
7.3% |
21.5% |
21.1% |
18.9% |
21% |
13.7% |
21.6% |
12.2% |
11.8% |
30.9% |
22.8% |
6% |
7.6% |
10.1% |
21,2% |
17.5% |
16% |
4.8% |
11.8% |
3 or
higher |
68.5% |
53.1% |
55% |
59.5% |
58.8% |
60.2% |
56.6% |
60.1% |
62% |
58.2% |
50.9% |
72.5% |
82.9% |
73.6% |
62.6% |
68.3% |
59.9% |
80.8% |
70.7% |
2019 AP SCORES
| Scores |
AP
BIO
|
AP
Environ
Sci |
AP
CHEM |
AP
Stats |
AP
US
Hist |
AP
World
History |
AP
US
Gov't |
AP
Eng
Lit &
Comp |
AP
Eng Lang
&
Comp |
AP
Human
Geog |
AP
Physics
1 |
AP
Physics
2 |
AP
Physics C
Mechanics |
AP
Physics
C
Electricity
Magnetism |
AP
Macro
Econ |
AP
Micro
Econ |
AP
Calc
AB |
AP
Calc
BC |
AP Computer Sci |
| 5 |
7.1% |
9.5% |
10.7% |
14.5% |
12/1% |
8.7% |
12.9% |
6.2% |
10.1% |
10.7% |
6.2% |
12.6% |
35.9% |
34.6% |
17.6 |
22.2% |
18.9% |
43.2% |
27% |
| 4 |
22.1% |
25.9% |
16.2% |
18% |
18.7% |
19% |
12.4% |
15.9% |
18.5% |
18.3% |
17.8% |
19.8% |
27.2% |
22.6% |
22.9% |
28.4% |
18.8% |
18.5% |
22.1% |
| 3 |
35.4% |
14.2% |
27.7% |
26.7% |
23.5% |
28.3% |
29.9% |
28% |
26.5% |
20.1% |
20.6% |
31.1% |
18% |
13.9% |
17.4% |
17.8% |
20.6% |
19.8% |
20.8% |
| 2 |
26.7% |
25.5% |
23.6% |
10.7% |
22% |
28.9% |
24.8% |
34.3% |
31.1% |
16.9% |
29.3% |
27.8% |
10.4% |
17.8% |
15.3% |
12.4% |
23.4% |
13.6% |
11.8% |
| 1 |
8.7% |
24.9% |
21.8 |
21.1% |
23.7% |
15.1% |
20% |
15.6% |
13.8% |
33.9% |
26.1% |
8.7% |
8.4% |
11.1% |
26.9% |
19.2% |
18.3% |
4.9% |
18.3% |
3 or
higher |
64.6% |
49.6% |
54.6% |
59.2% |
54.3% |
56% |
55.2% |
50.1% |
55.1% |
49.1% |
44.6% |
63.5% |
81.1% |
71.1% |
57.9% |
68.4% |
58.3% |
81.5% |
69.9% |
2019
Trevor Packer
says
AP Biology students achieve an all time
high: in 65 years of AP Biology, this year's students have
earned the highest % of 3+ scores ever, even while teachers have
expanded access to 6,000 more students this year.
1 student so far this year, out of
~265,000 worldwide, has earned all 120/120 points possible on
this year's AP Biology exam.
AP Biology multiple-choice: Students
scored exceptionally well on questions about Big Idea 4 (system
interactions) and Science Practice 4 (data collection) and 5
(data analysis & evaluation).
To increase the percentage of AP Biology
students earning 5s, much more proficiency with Science Practice
2 (use of mathematics) is necessary; the free, new resources,
available for teachers to unlock for students from Aug 1
this year, provide great help with this skill.
AP
Biology free-response question #2 (investigating protist
competition) has five parts; generally, students earning a 3 thi
year can answer two parts, students earning a 4 can answer 3
parts, and students earning a 5 can answer 4 or more parts.
FRQs |
AP
BIOLOGY TEST SCORE
AVERAGES
NEW TEST FORMAT
|
|
United
States
Avg
2013 |
BHS
Test
Scores
2013 |
United
States
Avg
2014 |
BHS
Test
Scores
2014 |
United States AVG
2015 |
BHS AVG
2015 |
United
States
AVG
2016 |
BHS
Test Scores
2016 |
United
States
AVG
2017 |
BHS
Test Scores
2017 |
United States AVG 2018 |
BHS Test Scores 2018 |
United States
AVG
2019 |
BHS
Test
Scores
2019 |
|
|
5.4% |
14.3% |
6.5% |
26.7% |
6.2% |
42.9% |
6.3% |
22.2% |
6.2% |
33.3% |
7.1% |
12.5% |
7.1% |
0% |
|
|
21.4% |
71.4% |
22.1% |
40.0% |
22% |
14.2% |
20.6% |
22.2% |
20.9% |
20% |
21.5% |
45.8% |
22.1% |
75% |
|
|
36.3% |
14.3% |
35.1% |
26.7% |
35.9% |
42.9% |
33.6% |
33.3% |
36.7% |
46.7% |
32.9% |
37.5% |
35.4% |
25% |
|
|
29.5% |
0% |
27.4% |
6.6% |
27.6% |
0% |
29.2% |
22.2% |
27.8% |
0% |
28.5% |
4.1% |
26.7% |
0% |
|
|
7.4% |
0% |
8.9% |
0% |
8.3% |
0% |
10.3% |
0% |
8.4% |
0% |
10% |
0% |
8.7% |
0% |
|
3 or Higher
|
63.1% |
100% |
63.8% |
93.4% |
64.1% |
100% |
60.5% |
77.8% |
63.8% |
100%
|
61.5% |
95.9% |
64.6% |
100% |
OTHER AP EXAMS
2018
| Scores |
AP
BIO
|
AP
Environ
Sci |
AP
CHEM |
AP
Stats |
AP
US
Hist |
AP
World
History |
AP
US
Gov't |
AP
Eng
Lit &
Comp |
AP
Eng Lang
&
Comp |
AP
Human
Geog |
AP
Physics
1 |
AP
Physics
2 |
AP
Physics C
Mechanics |
AP
Physics
C
Electricity
Magnetism |
AP
Macro
Econ |
AP
Micro
Econ |
AP
Calc
AB |
AP
Calc
BC |
AP Computer Sci |
| 5 |
7.1% |
8.5% |
12.6% |
14.1% |
10.4% |
8.7% |
13.4% |
5.6% |
10.6% |
24.7% |
5.2% |
11.2% |
28.6% |
35% |
18.2% |
19.2% |
19.% |
40.3% |
24.7% |
| 4 |
21.5% |
23.9% |
17.3% |
21.3% |
18.2% |
19.8% |
13.3% |
14.6% |
17.8% |
21.3% |
15% |
14.8% |
27.6% |
23.1% |
22.5% |
28% |
17.3% |
19% |
21.3% |
| 3 |
32.9% |
15.1% |
25% |
25.2% |
22.5% |
27.7% |
26.5% |
27.2% |
29% |
21.7% |
19.5% |
34.9% |
20.5% |
13.7% |
16.7% |
20.2% |
21.2% |
21% |
21.7% |
| 2 |
28.5% |
26.1% |
24.1% |
16.1% |
23.1% |
28.7% |
24.5% |
36.1% |
29.3% |
11.8% |
29.1% |
30.6% |
13.1% |
17.3% |
17.3% |
15.8% |
22.4% |
14.6% |
11.8% |
| 1 |
10% |
26.4% |
21% |
23.3% |
25.8% |
15.1% |
22.3% |
16.5% |
13.4% |
20.5% |
31.2% |
8.5% |
10.2% |
10.9% |
25.3% |
16.8% |
20.1% |
5.1% |
20.5% |
3 or
higher |
61.5% |
47.5% |
54.9% |
60.6% |
51.1% |
56.2% |
53.2% |
47.4% |
57.4% |
67.7% |
39.7% |
60.9% |
76.7% |
71.8% |
57.4% |
67.4% |
57.5% |
80.3% |
67.7% |
2018 UPDATES:
Have a great summer!
I was at the AP BIO Read
in Kansas City June 10-18.
260,000+ AP BIO tests to grade!
I graded 1,872 FRQ #2 questions! YIKES!
AP BIO Sing Along with Mr. W!
|
2018 Trevor Packer says;
The 2018 AP Biology scores: 5: 7.1%; 4: 21.5%; 3: 32.9%; 2:
28.5%; 1: 10%. This year, there were more strong students,
and more weak students – fewer in the middle. So all score
categories expanded, in comparison to 2017, except 3s.
AP Biology multiple-choice: students generally scored best
on questions about Big Idea 4 (interactions) and least well
on questions that required use of mathematics, including the
grid-ins, where 35% of students scored 0/5 points.
AP Biology students demonstrated a very strong
understanding of species interactions, generally earning
high scores on FRQ5 (symbiotic relationship between warblers
and cuckoos). 30% of students earned all 4/4 points
possible. AP Biology FRQ3 (investigating aquatic
pollination) best differentiates between students getting 3s
& those getting 2s. Students getting 3s are usually earning
at least 3 of these 4 points. 6/22/18 AP Biology
FRQ7 (investigating sex determination in fish) best
distinguished between students getting 3s and those getting
5s. Students getting 5s are usually earning all 4 of these
points.
2018 Released FRQ's |
2017
| Scores |
AP
BIO
|
AP
Environ
Sci |
AP
CHEM |
AP
Stats |
AP
US
Hist |
AP
World
History |
AP
US
Gov't |
AP
Eng
Lit &
Comp |
AP
Eng Lang
&
Comp |
AP
Human
Geog |
AP
Physics
1 |
AP
Physics
2 |
AP
Physics C
Mechanics |
AP
Physics
C
Electricity
Magnetism |
AP
Macro
Econ |
AP
Micro
Econ |
AP
Calc
AB |
AP
Calc
BC |
AP Computer Sci |
| 5 |
6.2 |
9.4 |
9.2 |
13.3 |
10.9 |
8.5 |
11.2 |
6.8 |
9.1 |
10.6 |
5.0 |
11.1 |
34.7 |
28.1 |
16.4 |
21.5 |
18.6 |
42.4 |
24.4 |
| 4 |
20.9 |
24.5 |
15.7 |
15.5 |
17.9 |
20.1 |
12.5 |
16.1 |
18.4 |
17.4 |
15.8 |
15.6 |
27.8 |
25.1 |
23.1 |
28.3 |
18.1 |
18.3 |
20.9 |
| 3 |
36.7 |
15.5 |
26.1 |
25 |
22.6 |
27 |
25.8 |
29.9 |
27.8 |
21 |
20.3 |
34.1 |
16.1 |
15.6 |
17.2 |
18.5 |
21 |
19.9 |
21.9 |
| 2 |
27.8 |
24.6 |
27 |
20.4 |
23.5 |
29.5 |
24.7 |
33.9 |
30.7 |
17.2 |
29.5 |
29.7 |
13 |
18.2 |
16.2 |
12.8 |
21.9 |
14.3 |
11.5 |
| 1 |
8.4 |
26 |
22 |
25.8 |
25.1 |
14.9 |
25.8 |
13.3 |
14 |
33.8 |
29.4 |
9.5 |
8.4 |
13 |
27.1 |
18.9 |
20.4 |
5.1 |
21.3 |
3 or
higher |
63.8 |
49.4 |
51 |
53.8 |
51.4 |
55.6 |
49.5 |
52.8 |
55.3 |
49 |
41.1 |
60.8 |
78.6 |
68.8 |
56.7 |
68.3 |
57.7 |
80.6 |
67.2 |
2017 Trevor Packer says;
AP Biology students and teachers
have achieved the highest number of scores of 3+ of any of the
past 5 years.
1 student out of 256,000 worldwide earned all
120/120 points possible on this year's AP Biology exam.
AP
Biology multiple-choice section: Students scored highest on
cellular processes questions and lowest on genetics questions.
AP Biology free-response: Students did very well constructing &
analyzing food webs (Q4) and evaluating impact of algal growth
(Q5).
AP Biology free-response: Many students really
struggled with detecting DNA damage (Q6); 59% earned 0 on it
2017 Released FRQ's |
OTHER AP EXAM SCORES 2016
| Scores |
AP
BIO
|
AP
Environ
Sci |
AP
CHEM |
AP
Stats |
AP
US
Hist |
AP
World
History |
AP
US
Gov't |
AP
Eng
Lit &
Comp |
AP
Eng Lang
&
Comp |
AP
Human
Geog |
AP
Physics
1 |
AP
Physics
2 |
AP
Physics
Mechanics |
AP
Macro
Econ |
AP
Micro
Econ |
AP
Calc
AB |
AP
Calc
BC |
AP Computer Sci |
| 5 |
6.3 |
7.4 |
9.7 |
13.9 |
11.7 |
6.5 |
12.4 |
7.4 |
10.6 |
11.9 |
4.3 |
8.5 |
30.2 |
16.1 |
15.3 |
24.4 |
48.4 |
20.7 |
| 4 |
20.6 |
23.0 |
15.1 |
21.7 |
17.9 |
15.5 |
13.5 |
17.7 |
17.5 |
20 |
13.6 |
16.7 |
27.4 |
23.4 |
27.3 |
17.4 |
15.5 |
20.4 |
| 3 |
33.6 |
14.8 |
27.5 |
24.7 |
22.5 |
29.2 |
25 |
29.5 |
27.2 |
19.8 |
21.3 |
34.3 |
18.5 |
16.2 |
23.0 |
17.6 |
17.6 |
23.2 |
| 2 |
29.2 |
26 |
25.3 |
15.7 |
23.4 |
28.9 |
24 |
33.4 |
32.1 |
19.2 |
30.7 |
32.2 |
13.9 |
17.5 |
14.4 |
9.7 |
5.9 |
12.5 |
| 1 |
10.3 |
28.8 |
22.4 |
24 |
24.5 |
19.9 |
25.1 |
12 |
12.6 |
29.1 |
30.1 |
8.2 |
10 |
26.8 |
20,.0 |
30.9 |
12.6 |
23.2 |
3 or
higher |
60.5 |
45.2 |
52.3 |
60.3 |
52.1 |
51.2 |
50.9 |
54.6 |
55.3 |
51.7 |
39.2 |
59.5 |
76.1 |
55.7 |
65.6 |
59.4 |
81.5 |
64.3 |
OTHER AP EXAM SCORES 2015
| Scores |
AP
BIO
|
AP
Environ
Sci |
AP
CHEM |
AP
Stats |
AP
US
Hist |
AP
World
History |
AP
US
Gov't |
AP
Eng
Lit &
Comp |
AP
Eng Lang
&
Comp |
AP
Human
Geog |
AP
Physics |
AP
Physics
C
Elect
Mag |
AP
Physics
C
Mechanics |
AP
Macro
Econ |
AP
Micro
Econ |
AP
Calc
AB |
AP
Calc
BC |
AP Computer Sci |
| 5 |
6.2 |
7.6 |
8.4 |
13.2 |
9.3 |
6.4 |
9.8 |
7.6 |
9.8 |
12.1 |
4.1 |
28.5 |
27.5 |
13.8 |
17.9 |
21.3 |
44.6 |
24.4 |
| 4 |
22 |
24.1 |
15.2 |
18.9 |
17.8 |
14 |
13.6 |
18.2 |
18.4 |
20.5 |
12.8 |
24.9 |
28.6 |
22 |
28.7 |
17.1 |
16.9 |
24.6 |
| 3 |
35.9 |
15.2 |
28.1 |
25.2 |
23.6 |
31.3 |
24.7 |
30.5 |
27.3 |
21.2 |
20 |
13.7 |
20.7 |
17.3 |
19.9 |
18.7 |
18.5 |
15.3 |
| 2 |
27.6 |
25.5 |
25.5 |
18.9 |
25 |
30.1 |
25 |
32.6 |
29.7 |
16.8 |
30.2 |
19.8 |
12.3 |
17.5 |
14.4 |
10.5 |
5.4 |
7.1 |
| 1 |
8.3 |
27.7 |
22.8 |
23.8 |
24.3 |
18.2 |
26.9 |
11.1 |
14.8 |
29.4 |
32.9 |
13.1 |
10.9 |
29.4 |
19.1 |
32.4 |
14.6 |
28.6 |
3 or
higher |
64.1 |
46.9 |
51.7 |
57.3 |
50.7 |
51.7 |
48.1 |
56.3 |
55.5 |
53.8 |
36.9 |
67.1 |
76.8 |
53.1 |
66.5 |
57.1 |
80.0 |
64.3 |
|
|
OTHER AP EXAM SCORES 2014
| Scores |
AP
BIO
|
AP
Environ
Sci |
AP
CHEM |
AP
Stats |
AP
US
Hist |
AP
World
History |
AP
Gov't |
AP
Eng
Lit &
Comp |
AP
Eng Lang
&
Comp |
AP
Human
Geog |
AP
Physics
B |
AP
Physics
C
Elect
Mag |
AP
Physics
C
Mechanics |
AP
Macro
Econ |
AP
Micro
Econ |
AP
Calc
AB |
AP
Calc
BC |
AP Computer Sci |
| 5 |
6.5% |
8.2% |
10.1% |
14% |
11% |
6.4% |
19.6% |
7.7% |
9.5% |
11% |
14.3% |
32% |
30.8% |
15.1% |
14% |
24.3% |
48.6% |
20.9% |
| 4 |
22.2% |
23.6% |
16.6% |
20.9% |
21.3% |
15.8% |
23.7% |
17.8% |
18% |
20% |
18.5% |
25.3% |
26.1% |
22.8% |
28.5% |
16.7% |
16.8% |
23% |
| 3 |
35.1% |
15.4% |
25.7% |
24.5% |
20.2% |
31.7% |
18.8% |
29.5% |
28.5% |
21.1% |
26.9% |
13.1% |
19% |
18.9% |
21.9% |
17.7% |
16.4% |
16.9% |
| 2 |
27.4% |
25.6% |
25.8% |
17.9% |
27.9% |
27.9% |
21.9% |
33% |
30.1% |
18.4% |
17.5% |
17.4% |
13.3% |
17.9% |
16% |
10.8% |
5.2% |
7.7% |
| 1 |
8.8% |
27.2% |
21.8% |
22.7% |
19.6% |
18.2% |
16% |
12% |
13.9% |
29.5% |
22.8% |
12.2% |
10.8% |
25.3% |
19.6% |
30.5% |
13.3% |
31.5% |
3 or
higher |
63.8% |
47.2% |
52.4% |
59.4% |
52.5% |
53.9% |
62.1% |
55% |
56% |
52.1% |
59.7% |
70.4% |
75.9% |
56.8% |
64.4% |
58.7% |
81.8% |
60.8% |
OTHER AP EXAM SCORES 2013
|
| Scores |
AP
BIO
|
AP
Environ
Sci |
AP
CHEM |
AP
Stats |
AP
US
Hist |
AP
World
History |
AP
Gov |
AP
Eng
Lit &
Comp |
AP
Eng Lang
&
Comp |
AP
Human
Geog |
AP
Physics
B |
AP
Physics
C
Elect
Mag |
AP
Physics
C
Mechan |
AP
Macro
Econ |
AP
Micro
Econ |
AP
Calc
AB |
AP
Calc
BC |
AP Computer Sci |
| 5 |
5.4 |
7.7 |
18.2 |
12.6 |
10.6 |
5.7 |
11.2 |
7.6 |
10.3 |
12.0 |
15.2 |
28.6 |
25.9 |
13.7 |
16.7 |
23.8 |
45.3 |
26.9 |
| 4 |
21.4 |
23.3 |
21.3 |
20.2 |
21.5 |
13.5 |
14.3 |
18.9 |
16.1 |
20.3 |
19.7 |
25.0 |
26.0 |
22.6 |
28.4 |
18.0 |
16.5 |
26.7 |
| 3 |
36.3 |
16.9 |
19.0 |
25 |
21.8 |
29.4 |
26.2 |
31.6 |
28.7 |
20.8 |
26.4 |
13.7 |
21.1 |
16.8 |
20.6 |
17.4 |
18.9 |
14.0 |
| 2 |
29.5 |
25.6 |
15.1 |
18.8 |
27.2 |
30.4 |
24.9 |
31.6 |
29.8 |
18.7 |
16.8 |
19.9 |
14.9 |
19.6 |
15.4 |
11.2 |
5.4 |
6.9 |
| 1 |
7.4 |
26.5 |
26.4 |
23.4 |
18.9 |
21 |
23.4 |
10.3 |
15.1 |
28.2 |
21.9 |
12.8 |
12.1 |
27.3 |
18.9 |
29.6 |
13.9 |
25.5 |
3 or
higher |
63.1 |
47.9 |
58.5 |
57.8 |
53.9 |
48.6 |
51.7 |
58.1 |
55.1 |
53.1 |
61.3 |
67.3 |
73.0 |
53.1 |
65.7 |
59.2 |
80.7 |
67.6 |
US AP EXAM AVERAGES 2012
| Scores |
AP
BIO
|
AP
Environ
Sci |
AP
CHEM |
AP
Stats |
AP
US
Hist |
AP
World
History |
AP
Gov |
AP
Eng
Lang &
Comp |
AP
Eng
Lang
& Lit |
AP
Human
Geog |
AP
Physics
B |
AP
Physics
C
Elect
Mag |
AP
Physics
C
Mechan |
AP
Macro
Econ |
AP
Micro
Econ |
AP
Calc
AB |
AP
Calc
BC |
| 5 |
19.4 |
8.7 |
15.3 |
12.2 |
11.8 |
6.9 |
12.5 |
10.9 |
8.3 |
12.6 |
15.0 |
32.6 |
31.3 |
13.1 |
14.8 |
24.9 |
50.7 |
| 4 |
16.9 |
24.9 |
19.1 |
20.9 |
21.4 |
15.7 |
14.9 |
20.2 |
17.9 |
19.5 |
19.1 |
24.0 |
26.5 |
23.8 |
28.3 |
16.9 |
15.8 |
| 3 |
14.3 |
16.6 |
20.2 |
25.7 |
21.7 |
30.4 |
24.8 |
28.9 |
30.4 |
20.4 |
26.8 |
13.9 |
18.9 |
18.2 |
21.8 |
17.3 |
16.2 |
| 2 |
14.6 |
24.4 |
15.0 |
18.1 |
26.5 |
30.0 |
24.6 |
28.9 |
32.3 |
17.9 |
17.2 |
17.5 |
12.9 |
18.2 |
16.3 |
10.3 |
5.5 |
| 1 |
34.8 |
25.4 |
30.4 |
23.1 |
18.6 |
17.5 |
23.2 |
12.0 |
11.1 |
29.6 |
21.9 |
12.0 |
10.4 |
26.7 |
18.8 |
30.6 |
11.8 |
3 or
higher |
50.6 |
50.2 |
54.6 |
58.8 |
54.9 |
53.0 |
62.2 |
59.8 |
56.6 |
52.5 |
60.9 |
70.5 |
76.7 |
55.1 |
64.9 |
59.1 |
82.7 |
Old Test Format
|
|
Overall
United States Averages
('94-'06)
|
United
States
Average
2005 |
United
States Average
2006 |
United States
Average
2007
|
United States Average
2008
|
BHS Test Scores
2008 |
United States
Average
2009 |
United States Average
2010 |
BHS
Test
Scores
2010 |
United
States
Average
2011 |
BHS
Test
Scores
2011 |
United
States
Average
2012 |
BHS
Test Scores
2012 |
|
|
|
18.2 % |
19.6 % |
19.3
%
|
18.6
%
|
25 %
|
19.5 % |
18.7 % |
27.8% |
18.8% |
50% |
19.4% |
52.4% |
|
|
|
20.1 % |
20.3 % |
20.3
%
|
15.6
%
|
25 %
|
15.5 % |
15.1 % |
33.3% |
16.5% |
0 % |
16.9% |
28.6% |
|
|
|
22.9 % |
21.2 % |
21.2
%
|
16.1
%
|
25 %
|
15.8 % |
15.4 % |
33.3% |
15.2% |
25% |
14.3% |
4.8% |
|
|
|
23.3 % |
23.3 % |
23.2
%
|
15.6
%
|
25 %
|
15.1 % |
14.1 % |
0 % |
14.6% |
25% |
14.6% |
14.3% |
|
|
|
15.5 % |
15.6 % |
15.9
%
|
34.6
%
|
0 %
|
34.0 % |
36.6 % |
5.6% |
34.8% |
0 % |
34.8% |
0 % |
|
3 or Higher
|
63.6 % |
61.2 % |
61.1 % |
60.8 % |
50.3 % |
75 % |
50.8% |
49.2 % |
94.4% |
56.2% |
75% |
50.6% |
85.8% |
| YEAR |
Total in class at start |
Total
in class
at end |
5's |
4's |
3's |
2's |
1's |
Didn't take test |
Drops at
semester |
| 2007-08 |
17 |
9 |
2 |
2 |
2 |
2 |
0 |
1 |
8 |
| 2009-10 |
25 |
20 |
5 |
6 |
6 |
0 |
1 |
2 |
5 |
| 2010-11 |
13 |
11 |
4 |
0 |
2 |
2 |
0 |
3 |
2 |
| 2011-12 |
27 |
26 |
11 |
6 |
1 |
3 |
0 |
6 |
1 |
| 2012-13 |
18 |
11 |
1 |
5 |
1 |
0 |
0 |
4 |
5 |
| 2013-2014 |
22 |
18 |
4 |
6 |
4 |
1 |
0 |
3 |
4 |
| 2014-2015 |
8 |
8 |
3 |
1 |
3 |
0 |
0 |
1 |
0 |
| 2015-2016 |
21 |
17 |
2 |
2 |
3 |
2 |
0 |
8 |
4 |
| 2016-2017 |
18 |
17 |
5 |
3 |
7 |
0 |
0 |
2 |
2 drop
+1 add |
| 2017-2018 |
43 |
40 |
3 |
11 |
9 |
1 |
0 |
16 |
4 drop
+1 add |

AND
NOW WE WAIT . . .
YAY! for you. You kicked some butt
! I'm so proud of you!

2018 AP SCORES
|
BHS 2018 Scores |
|
|
5 |
4 |
3 |
2 |
1 |
Class
Average |
|
# of
students |
3 |
11 |
9 |
1 |
0 |
3.67 |
2017 AP SCORES
|
BHS 2017 Scores |
5 |
4 |
3 |
2 |
1 |
Class
Average |
| # of
students |
5 |
3 |
7 |
0 |
0 |
3.87 |
2016 AP SCORES
|
BHS 2016 Scores |
5 |
4 |
3 |
2 |
1 |
Class
Average |
| # of
students |
2 |
2 |
3 |
2 |
0 |
3.44 |
2015 AP SCORES
|
BHS 2015 Scores |
5 |
4 |
3 |
2 |
1
|
Class
Average |
| # of
students |
3 |
1 |
3 |
0 |
0 |
4.0 |
2014 AP SCORES
|
BHS 2014 Scores |
5 |
4 |
3 |
2 |
1
|
Class
Average |
| # of
students |
4 |
6 |
4 |
1 |
0 |
3.87 |
2013 AP SCORES
|
BHS 2013 Scores |
5 |
4 |
3 |
2 |
1
|
Class
Average |
|
Total students |
1 |
5 |
1 |
0 |
0 |
4.0
|
2012 AP SCORES
|
BHS 2012 Scores |
5 |
4 |
3 |
2 |
1
|
Class
Average |
| Total students |
11 |
6 |
1 |
3 |
0 |
4.19 |
2011 AP SCORES
|
BHS 2012 Scores |
5 |
4 |
3 |
2 |
1
|
Class
Average |
| Total students |
4 |
0 |
2 |
2 |
0 |
3.75 |
2010 AP SCORES
|
BHS 2010 Scores |
5 |
4 |
3 |
2 |
1
|
Class
Average |
| Total students |
5 |
6 |
6 |
0 |
1 |
3.78 |
2008 AP SCORES
|
BHS 2008 Scores |
5 |
4 |
3 |
2 |
1
|
Class
Average |
| Total students |
2 |
2 |
2 |
2 |
0 |
3.5 |
 |
GREETINGS BROOKINGS AP BIO STUDENTS!
Had a great time at the AP Bio Reading!
240,279 exams ! |
TWEETS FROM TREVOR PACKER
2016
AP Biology FRQs:
poor performance on
Q7 (chromosomal inheritance; - 66% earned 0 pts) and Q8 (effect of
exercise: - 50% earned 0 pts.)
best performance was on Q1 (allele
frequencies), followed by Q5 (obligate mutualism)
AP Biology
grid ins that require mathematical calculation: Students performed
quite poorly: More than 50% earn 0 or 1
AP Biology multiple
choice: Students scored very well on Big Idea 2 (cellular
processes). and least well on Science Practice 2 (using math)
Good predictor of whether you scored high on this year's AP Bio
exam is how well you did on Q4 (gene expression)
http://spr.ly/6011BQea5
|
2015
FROM Trevor Packer
~AP BIOLOGY overall results are
released
~ AP BIO students did extremely well on Q6 (genetic diversity); 40%
of students got perfect scores on that question
~ AP BIO students really struggled on Q2 (cellular metabolism), Q8
(immune response), and especially Q7 (odor perception: 70% of
students got 0 pts).
~ Truly great work from AP BIO teachers teaching students to apply
math to scientific problems: 2013 35% avg correct; 2015: avg 55%
correct.
|
2014
AP News from Trevor
Packer@AP_Trevor
Most AP Biology students earned enough pts to get a 2,3,4, but very
few scored well enough on the grid-ins and free-response to score a
5.
AP Biology grid-in questions require students to use mathematics to
solve biological problems. The avg score on these was very low: 36%.
AP Biology multiple-choice: last year, students earned 63% correct
on average; this year, 61%.
What % of AP Bio students earned 0 pts on these FRQs? Q5
(polypeptides): 45%. Q6 (organelles): 49%. Q8 (hormone-signaling):
54%.
AP Bio students performed well on Q3 (evaluating fossils of a
transitional species) and Q7 (effect of alcohol on urine
production).
ANALYSIS FROM COLLEGE BOARD |
2013
AP News from Trevor
Packer@AP_Trevor
Most AP Biology students earned enough pts to get a 2,3,4, but very
few scored well enough on the grid-ins and free-response to score a
5.
AP Biology grid-in questions require students to use mathematics to
solve biological problems. The avg score on these was very low: 36%.
AP Biology multiple-choice: last year, students earned 63% correct
on average; this year, 61%.
What % of AP Bio students earned 0 pts on these FRQs? Q5
(polypeptides): 45%. Q6 (organelles): 49%. Q8 (hormone-signalling):
54%.
AP Bio students performed well on Q3 (evaluating fossils of a
transitional species) and Q7 (effect of alcohol on urine
production).
ANALYSIS FROM COLLEGE BOARD |
|
AP Biology students achieved higher scores, on average, on the free-response
questions this year, so a 25% increase in the number of 5s.
3 students (out of ~214,000) achieved perfect scores of 120/120 pts on the
AP Biology exam. Next stop: curing cancer.
The majority of AP Bio students aced free-response question #3 on ecological
impacts, earning all 4 of of 4 points possible.
The
most difficult AP Bio free-response question for many was #7
(thermoregulation in animals); 37% of students earned 0 points on it.Questions 2 & 6 really separated the strong from the weak AP Bio students.
Try them if curious to see where you fall:http://ow.ly/yeCSg
|
INFO on 2014 AP BIO Exam RESULTS from College Board
Trevor
Packer@AP_Trevor
the College Board’s head of
AP tweeted this about the AP Bio Exam
Overall, performance on
this year’s AP Biology Exam represents slightly higher student
ability levels this year than last.
AP Biology 2012 results:
19.4%=5; 16.9%=4; 14.3%=3; 14.6%=2; 34.8%=1.
These may shift
slightly as late exams are scored
5 students out of ~200,000 nationwide had a perfect (150/150) score on the AP
BIO EXAM!
FRQ Q2(oxygen consumption) had the highest mean score
FRQ Q3 (information flow in cells) had lowest mean score (~25% got a 0/10)
|
DNA
|
|
GREETINGS BROOKINGS AP BIO STUDENTS!
Had a great time at the AP Bio Reading!
244,311 exams!
Home now... results are here! |
2014 AB BIO STUDENTS THINGS TO DO:
1. Follow
slideshow directions and use this
TEXTBOOK LINK
to
register for your online textbook.
Student Access Code: SSNAST-RADII-SHAYS-KAZAN-SLANT-GALES
2. Write down your username and password ! ! ! ! ! ! !
! !
3. After you have registered JOIN
OUR CLASS
Enter the following Class ID to join our class:
Class ID: BROOKINGSAPBIO2014
YAY! for you. You kicked some butt
! I'm so proud of you!
SDSU AP Credit
What's happening to your exam right now?
If you want to keep updated on what is happening you can
"follow" Trevor Packer
the head of AP
on Twitter.
If you just can't wait until July 6th, AP Scores are available by phone
for a fee of $8 per call beginning on July 1. Call 888-308-0013
Register for our WIKI
1. Click on this
WIKI
link
2. Choose JOIN in top right hand corner.
3. DO NOT SIGN IN! Choose Create an account at top.
4. You will choose a USER NAME and PASSWORD.
PLEASE WRITE THESE DOWN on your login sheet in your
binder/planner!
5. Login with your new user name/password.
6. You will need to give an email (Use one you will check)
7. Send me a message asking to join the wiki.
8. You will get an email saying you have been accepted.
9. Go to the wiki page.
10. Click on EDIT and respond to the first assignment
OUR
WIKI
STUDENTS REGISTERED FOR AP BIO for
2011-2012
Meeting in my room after school Tuesday May 17!
If you can't be there come and see me BEFORE school is out on FRIDAY!
1. Use directions above to register
for your online textbook.
2.
Review Biology
I & II content so you are ready to jump into AP BIO in the fall.
We are going to assume you know the concepts covered in this class and we will
focus on learning NEW content.
3. Check out the
Campbell
& Reece textbook site to see what you will be
learning about. Try some of the self quizzes
| This is the textbook
we will use |
|
4. Check out the AP
Central website to see what resources are there to help you.
(Course description, sample ?'s, Exam info, Past AP BIO FRQ's with rubrics, etc)
5. Check the AP
Central website college link to see whether the college you will be
attending accepts AP exam scores for credit and Exam score you need to get the
credit you want.
"AP stands for autopilot". You are
responsible for your own learning.
~ Kim Foglia AP Biology Guru
VOCAB
Sources:
http://www.aw-bc.com/campbell/
 http://www.gifanimations.com
 http://www.extension.iastate.edu/gif/
 http://www.extension.iastate.edu/gif/
 http://www.smithlifescience.com/PH001LessonPlans.htm

 http://www.smithlifescience.com/PH001LessonPlans.htm
http://www.science20.com/life_sciences

http://www.science20.com/fish_feet/why_does_my_baby_have_a_tail
test password
 OUR WIKISPACE Login
 WEB CT


picture
evol2
STUDENTS REGISTERED FOR AP BIO for
2009-2010
Before May 28 you should:
1. Attend the informational meeting
after school on Tuesday May 19
OR see Mrs. Riedell
2. Return your student info sheet including
a current email address
3. Click here
to REGISTER FOR YOUR ONLINE TEXTBOOK
Create a password THEN enter the access code below and join our class
ACCESS CODE:
SSNAST-NEUSS-UPEND-KANZU-GIBBY-ADOWA
Join a class:
cm981742
Over the summer you should:
1. Review Biology
I & II content so you are ready to jump into AP BIO in the fall.
We are going to assume you know the concepts covered in this class and we will
focus on learning NEW content.
2. Check out the
Campbell
& Reece textbook site to see what you will be
learning about. Try some of the self quizzes this summer.
| This is the textbook
we will use |
|
3. Check out the AP
Central website to see what resources are there to help you.
(Course description, sample ?'s, Exam info, etc)
4. Check the AP
Central website college link to see whether the college you will be
attending accepts AP exam scores for credit and Exam score you need to get the
credit you want.
HAVE A GREAT SUMMER!
"AP stands for autopilot". You are
responsible for your own learning.
~ Kim Foglia AP Biology Guru
2009-2010 AP BIO Students:
It was an amazing year! Have a great summer!
Scores ARE OUT! HOW
DID WE DO?
| Score |
5 |
4 |
3 |
2 |
1 |
| Total students |
5 |
6 |
6 |
0 |
1 |
YAY! for you. You guys kicked butt! I'm
so proud of you!
 me
me
AP BIOLOGY TEST SCORE
AVERAGES
|
|
Overall
United States Averages
('94-'06)
|
United
States
Average
2005 |
United
States Average
2006 |
United States
Average
2007
|
United States Average
2008
|
BHS
Test Scores
2008 |
United
States
Average
2009 |
United
States Average
2010 |
BHS
Test
Scores
2010 |
|
|
|
18.2
% |
19.6
% |
19.3 %
|
18.3 %
|
25 %
|
19.5
% |
18.4% |
27.8% |
|
|
|
20.1
% |
20.3
% |
20.3 %
|
15.7 %
|
25 %
|
15.5
% |
15.1
% |
33.3% |
|
|
|
22.9
% |
21.2
% |
21.2 %
|
16.1 %
|
25 %
|
15.8
% |
15.4
% |
33.3% |
|
|
|
23.3
% |
23.3
% |
23.2 %
|
15.3%
|
25 %
|
15.1
% |
14.1
% |
0% |
|
|
|
15.5
% |
15.6
% |
15.9 %
|
34.6 %
|
0 %
|
34.0
% |
37.0
% |
5.6% |
|
3
or Higher
|
63.6 % |
61.2
% |
61.1
% |
60.8
% |
50.3
% |
75
% |
50.8 % |
48.9
% |
94.4% |
US AP EXAM AVERAGES 2011
| |
AP
BIO
|
AP
CHEM |
AP
Stats |
AP
US
Hist |
AP
Gov |
AP
Eng
Lang &
Comp |
AP
Eng
Lang
& Lit |
AP
Human
Geog |
AP
Physics
B |
AP
Physics
C
Elect
Mag |
AP
Physics
C
Mechan |
AP
Micro
Econ |
AP
Calc
AB |
AP
Calc
BC |
| 5 |
18.5% |
16.2 |
12.1 |
11.0 |
12.6 |
11.1 |
8.4 |
11.7 |
15.0 |
32.0 |
26.5 |
14.6 |
21.0 |
47.0 |
| 4 |
16.5% |
18.5 |
21.3 |
20.8 |
14.0 |
20.0 |
17.8 |
18.1 |
19.1 |
24.5 |
24.2 |
25.9 |
16.3 |
16.3 |
| 3 |
15.2% |
24.3 |
25.1 |
21.0 |
25.1 |
30.1 |
30.9 |
21.3 |
26.3 |
14.0 |
22.3 |
21.6 |
18.5 |
17.2 |
| 2 |
14.7% |
26.9 |
17.7 |
26.7 |
24.3 |
27.5 |
32.1 |
17.5 |
17.7 |
17.7 |
14.2 |
16.0 |
10.8 |
5.9 |
| 1 |
35.1% |
13.9 |
23.8 |
20.5 |
24.0 |
11.3 |
10.8 |
31.4 |
21.9 |
11.8 |
12.9 |
21.9 |
33.4 |
13.6 |
3 or
higher |
50.2% |
59.0 |
58.5 |
52.8 |
51.7 |
61.2 |
57.1 |
51.1 |
60.4 |
70.5 |
73.0 |
62.1 |
55.8 |
8O.5 |
KIM FOGLIA AWARD LINKS
Teachers using our
site
justin body system project
Keri body system project
Biomes Travel Brochures
Sam- Temperate Deciduous Forest
Nick- Taiga
Lindun - Wetlands
Yang -
Rain Forest
Lynn -
Savannah
Jamie -
Intertidal
Gabe - Tundra
Megan- Desert
Mia - Temperate Grasslands
Spencer - Chaparral
Lindun Darwin Facebook
Animal projects
SLOTH
Hedgehog
Reticulated Giraffe
Openers
Cell parts Outlaw
Emergent props
Endosymbiosis +themes
Science in News
Earth Hour
Garbage gyre
http://local.brookings.k12.sd.us/krscience/youtubevideos/garbargegyregood.wmv
Variable song
http://local.brookings.k12.sd.us/krscience/youtubevideos/variablesong2.wmv
Oxidate it or love it Electron to the Next one
http://local.brookings.k12.sd.us/krscience/youtubevideos/Oxidate_It_Or_Love_It__Electron_to_the_Next_One.avi
Rachel Maddow
SD Legislature passes Global Warmingresolution
http://local.brookings.k12.sd.us/krscience/youtubevideos/rachelmaddow.avi
 |
 |
 |
 |
| EVOLUTION |
MATTER &
ENERGY |
INFORMATION |
INTERACTIONS |
| |
 |
 |
 |
 |
| EVOLUTION |
MATTER &
ENERGY |
INFORMATION |
INTERACTIONS |
| |
 |
|
 |
 |
| EVOLUTION |
MATTER &
ENERGY |
INFORMATION |
INTERACTIONS |
| |
|
|
 |
|
 |
| EVOLUTION |
MATTER & ENERGY |
INFORMATION |
INTERACTIONS |
| |
 |
 |
 |
 |
| EVOLUTION |
MATTER & ENERGY |
INFORMATION |
INTERACTIONS |
| |
 |
 |
 |
 |
| EVOLUTION |
MATTER & ENERGY |
INFORMATION |
INTERACTIONS |
| |
 |
|
|
|
| EVOLUTION |
MATTER & ENERGY |
INFORMATION |
INTERACTIONS |
| |
 |
 |
 |
 |
| EVOLUTION |
MATTER & ENERGY |
INFORMATION |
INTERACTIONS |
| |
http://thelivingenvironmentcheatsheet.blogspot.com/2008/04/human-impact-on-environment.html
http://quinceydeters.smugmug.com/Competitions/Contests/04-Quincey-Deters-Wonderful/885672583_S5dGa-L-6.jpg
http://evolution.berkeley.edu/evolibrary/images/evo/vert_tree.gif
http://tolweb.org/tree/learn/concepts/whatisphylogeny.html
http://www.vuw.ac.nz/staff/angela_moles/daintreecaterpillar.JPG
http://hungamazone.com/wp-content/uploads/2012/01/two-cute-animals-cute-fox.jpg
http://www.technologyreview.com/files/12903/Mitochondrion_x220.jpg
http://clownfish-translator.com/img/pic2.jpg
http://web.williams.edu/imput/graphics/IVA3.jpg
 http://boingboing.net/2010/04/13/the-illustrated-cell.html
http://intranet.bisc.edu.eg/science/Home%20Page.htm
 http://intranet.bisc.edu.eg/science/robert_stewart/r_stewart_class_links.htm
 http://babyanimalz.com/
 http://www.care2.com/news/member/682890945/1349618
 http://2009rt8sciyunezzi.wordpress.com/2009/11/
 http://webecoist.com/2008/11/19/exotic-endangered-plants-flowers-trees-forests/
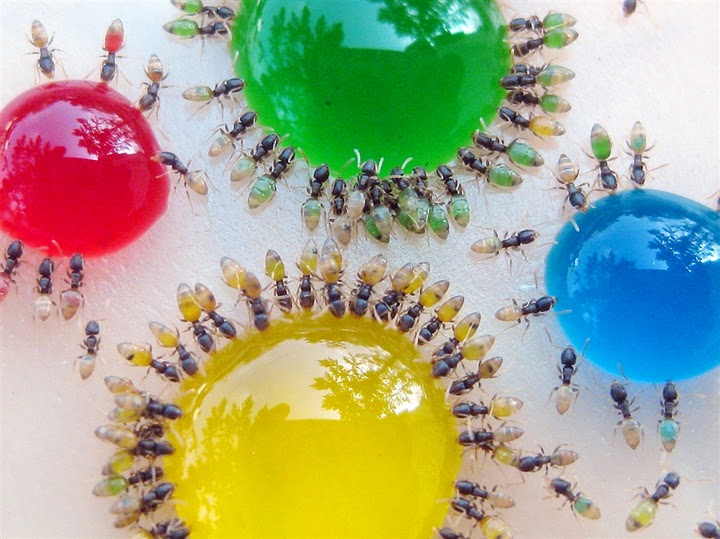
Image by Mohamed Babu
http://www.dailymail.co.uk/news/article-2022765/The-ants-multi-coloured-abdomens-exactly-theyve-eating.html?ito=feeds-newsxml
 http://bestanimations.com/Electronics/Video/Video.html
 http://news.bbc.co.uk/2/shared/spl/hi/pop_ups/05/sci_nat_visions_of_science_/html/1.stm
http://theiconoclast.info/?cat=13
http://smksjtbiology.blogspot.com/
http://www.aspb.org/education/GDLGames/GDLv2_chloroplast_ASPB_site.html
http://upload.wikimedia.org/wikipedia/commons/thumb/4/49/Plagiomnium_affine_laminazellen.jpeg/250px-Plagiomnium_affine_laminazellen.jpeg
 http://www.mrsmacdonaldteacher.com/science%20fun.html
http://www.age-of-the-sage.org/evolution/darwin_evolution_tree.jpg
http://4.bp.blogspot.com/_6evB6G77Hs8/TLx4CgxjFnI/AAAAAAAAFkU/lypRrD4WdHM/s1600/Michel_Volle_Predation.jpg
http://www.adventure-life.com/galapagos/galapagos-wildlife/galapagos-birdlife.php
http://libguides.northwestern.edu/henrietta_lacks
 http://occupycorporatism.com/wp-content/uploads/2012/05/dna_1.jpeg
http://4.bp.blogspot.com/_5BvcfMsTcMc/THLL9g9RVLI/AAAAAAAAA6o/5AF4JDoSRUY/s1600/Sunflower.jpg
http://msnbcmedia3.msn.com/j/ap/human%20evolution%20hfr-1614934716_v2.grid-5x2.jpg
http://www.newscientist.com/data/images/ns/cms/dn9989/dn9989-1_300.jpg
http://www.biologyreference.com/photos/enzymes-3755.jpg
http://www.evolution-rome2009.org/wp-content/uploads/2012/01/sc.jpg
 http://wnymedia.net/2012/07/cancer-rates-in-erie-county/
 http://wakeup-world.com/wp-content/uploads/2012/02/cancer.jpg
http://wpcontent.answcdn.com/wikipedia/commons/thumb/4/40/Wiki_tarantula.jpg/250px-Wiki_tarantula.jpg
http://chemistry.phillipmartin.info/chemistry_biogeochemical_cycles.html
 http://www.wordtoyou.net/design/mini-newspaper.gif
Congrats to Mrs. Tucker's AP Bio
students!
YAY! for you. You kicked some butt
! I'm so proud of you!